|
Clik on the
images to see the enlargement
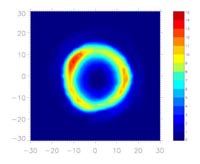 |
Polarized
emission map of the Moon at 8300MHz. Observed by 32m parabolic
antenna. |
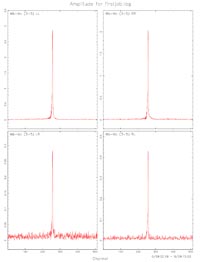 |
For the first time interference
fringes were found in a real time e-VLBI experiment involving
Medicina station.
The experiment with signals roued
via a fiber optic connection was conducted on March 9, 2006 at 5GHz,
on source 2007+777
(extragalactic radio sources, catalogued as
BLLac, redshift z=0.342).,
using a bit rate of 128Mbit/s.
The plots shown the results
relative to the Westerbork-Medicina baseline.
|
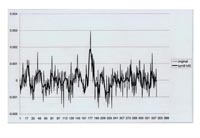 |
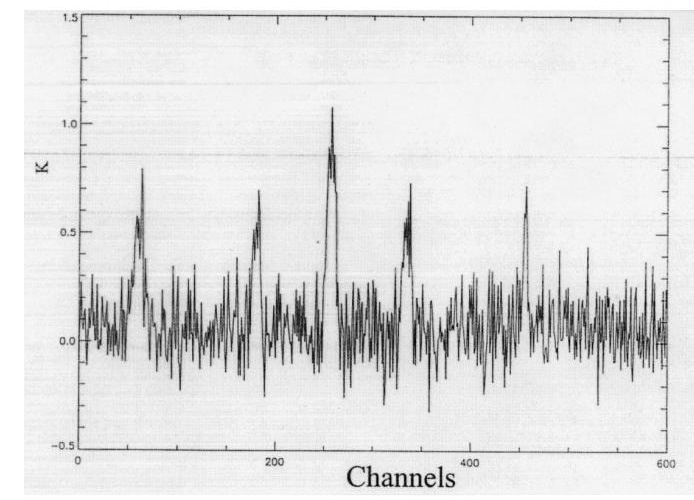
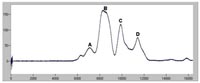
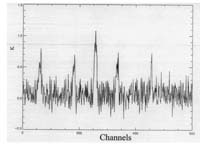
Spectral line
C252a
observed on CassiopeiaA at 408.7MHz. Kelvin vs Spectrum Channels.
Observed by Northern Cross.
|
 |
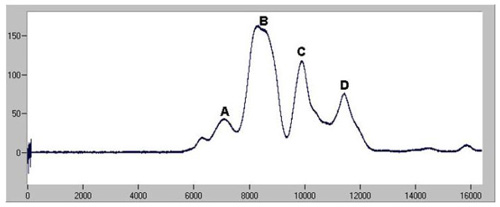
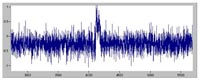
H2O
water maser line observed on W3OH
(massive star forming region in the Perseus spiral arm, at a distance
of 1.953 ±0.04 kpc) at 22235.079MHz. Kelvin vs Spectrum
Channels. Integration time 2.1h. Observed by 32m parabolic
antenna.
|
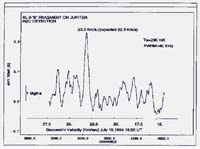 |
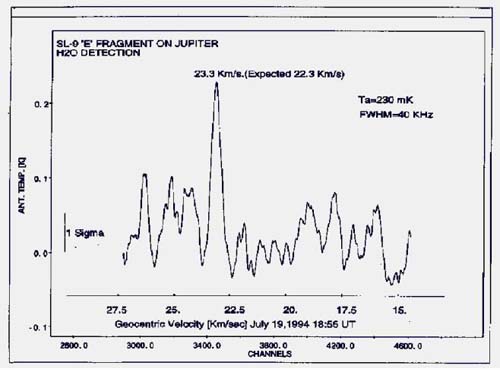
H2O
water maser emission at 22235.079MHz coming from the impact of the
Shoemaker-Levy comet
and Jupiter atmosphere, 1994. Observed by the 32m parabolic antenna.
Reference: C.B. Cosmovici, S. Montebugnoli, A.
Orfei, S. Pogrebenko, P. Colom
“First evidence of water maser
emission induced by a catastrophic impact”
Planetary and Space Science, vol.
44, No. 8, pp. 735-739,1996
|
 |
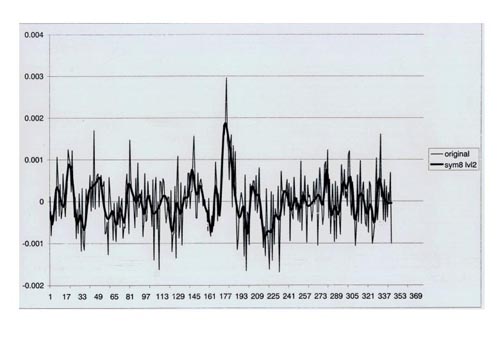
C2S
spectral line observed on L1544 (core
of a dense, compact pre-stellar region in Taurus) at 22234.033MHz. Kelvin vs Spectrum
Channels. Integration time 3.4h. Very bad weather conditions. Observed
by 32m parabolic antenna. |
 |
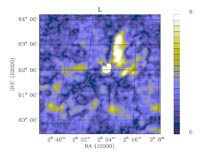 |
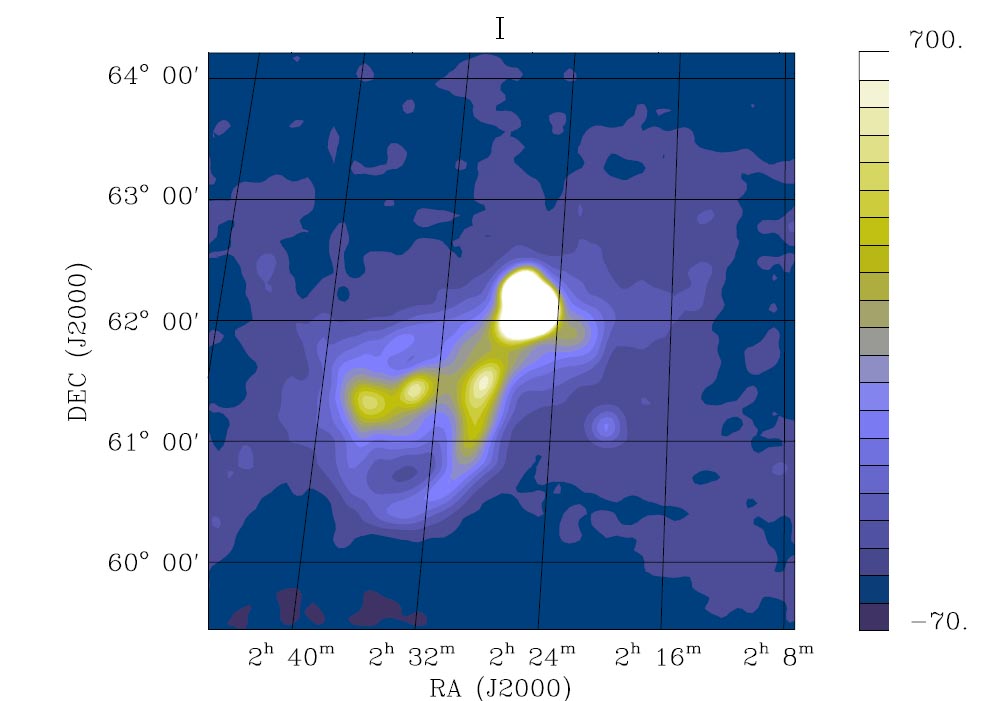
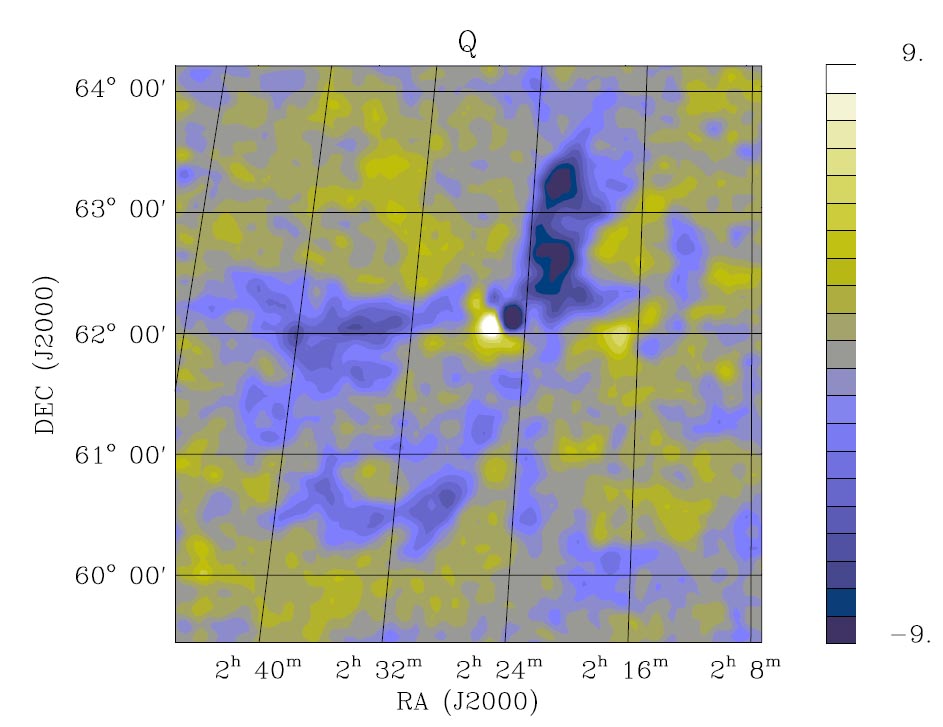
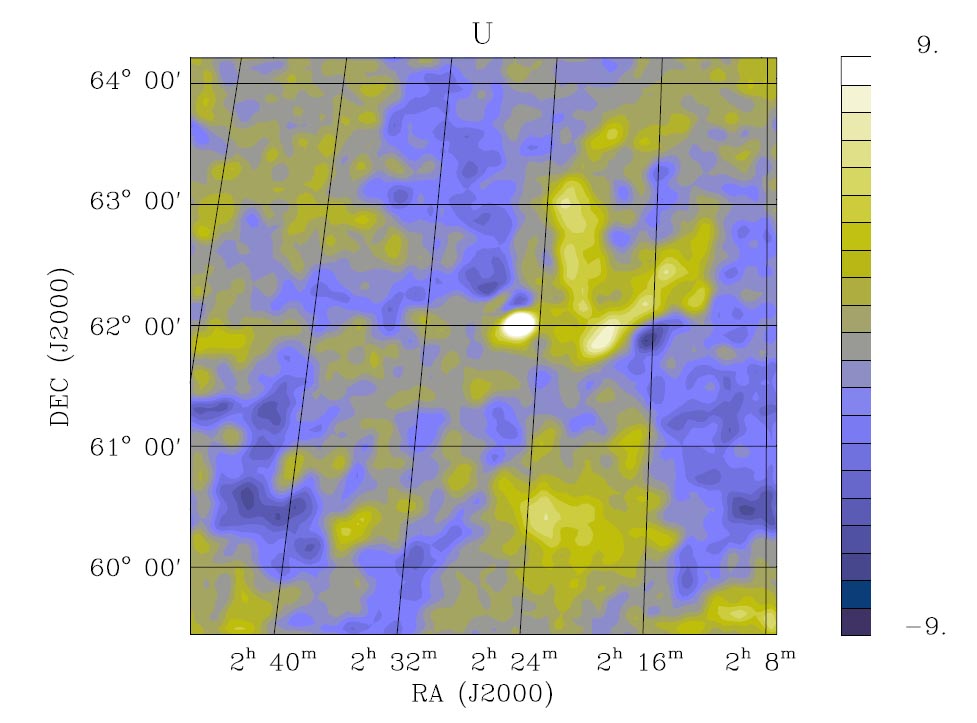
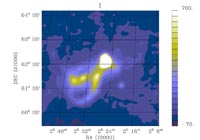
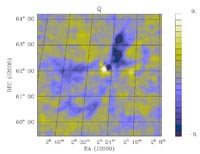
5o x
5o linear polarization map of the galactic diffuse emission
at 5070MHz. 80MHz bandwidth, september 2004.
Pixel dimension, 8 x 8 arcmin.
Integration time per pixel, 1
min. RMS noise per pixel, 1mK. Total observing time, 24h. Observed by
32m parabolic antenna.
I(mK)= total
power, Q,U(mK)= Stokes components of the linear polarization, L(mK)=
total linear polarization power.
|
 |
 |
 |
NH3(1,1)
spectral line observed on L483 (deeply
embedded low-mass protostar) at 23694.495MHz. Kelvin vs Spectrum
Channels. Integration time 691sec. Observed by 32m parabolic
antenna.
|
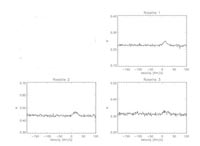 |
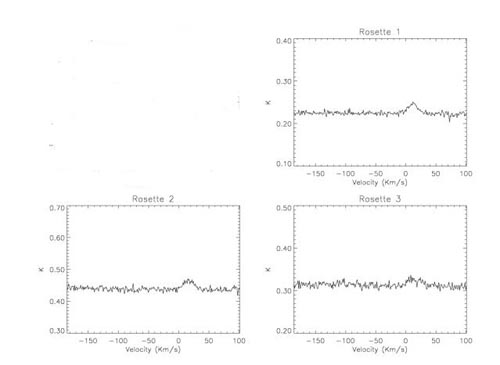
H92a
recombination line observed on three different Rosetta Nebula
positions (vast
cloud of dust and gas, extending over an area of more than 1 degree
across, or about 3 times the area covered by the full moon,
its parts have been assigned different
NGC numbers)
at 8309.4MHz. Kelvin vs Spectrum Channels. Total observed
time 23.5h. Observed by 32m parabolic antenna.
Reference: Tsivilev et al.,2002,New
Astronomy,7,449
|
|