12. Mspec0

| |
12. Mspec0 |
 |
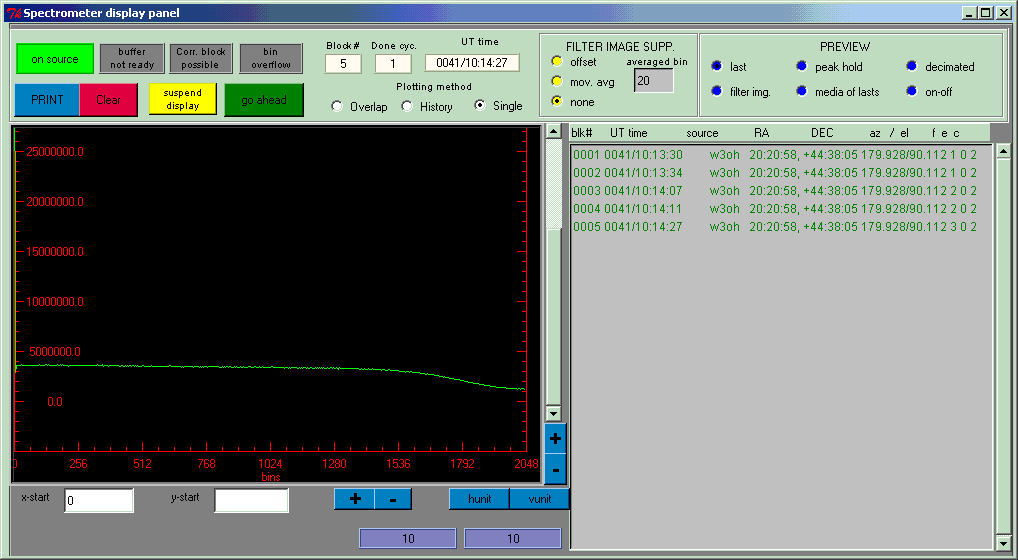
12.2 Output Panel

Fig. 12.2 : Mspec0, pannello di visualizzazione
In normal observing conditions the four buttons (top left) must be as shown in fig. 11.2 (On-source GREEN and the other three GREY). The first button can appear as follows :
YELLOW : Slewing
RED : Calibration
BLUE : Off-Source
The axis scale and the unit of measure can be changed using the buttons under the graph. The spectra can be viewed individually (Plotting method : single), overlapped (Plotting method : overlap), in time succession (Plotting method : history).
Other buttons :
- PRINT : generates an encapsulated postscript file
- CLEAR : cancels the display
- SUSPEND : stops the visualization only
- GO-AHEAD : in Manual mode starts the data acquisition
The grey panel shows a cycle summary.
The output panel contains two sub-section also :
|
Filter image supp |
- Offset : a filter is applied, corresponding to the medium level of the 10÷80% total power level.
- Mov. avg : the medium level corresponding to the desired spectral points number (selected in the "bin" box) is subtracted.
- None
|
Preview |
- Last : The data are shown per block.
- Peak old : Shows the last maximum peak.
- Filter img. : shape of the filter that will be subtracted from the spectra (see above)
- Media of lasts : shows the average of the last acquired spectra per type (On, Off, etc...)
- On-off : shows the spectra resulting from the ON-OFF operation.
![]()